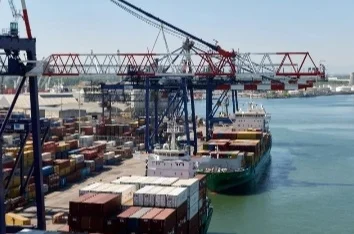
The analysis reveals that imports from the Middle East and the Indian subcontinent have declined sharply (-9.7%), totalling 1.65 million TEUs.
In the first half of 2026, container traffic to and from Europe (including Mediterranean ports) increased by 3.8%, reaching 29.6 million TEUs. This information comes from data collected by Container Trades Statistics (CTS), which is currently still provisional.
Inbound and outbound container trends at continental ports
However, inbound and outbound container trends at continental ports differed. Imports increased by 7.9% to reach 15.742 million TEUs, whereas exports decreased by 1.4% to reach 9.588 million TEUs. Intra-European trade accounted for a smaller proportion of the total (15%), increasing by 1.3% during the six months to reach 4.307 million TEUs.
The CTS analysis, which focuses on exports
The CTS analysis, which focuses on exports, highlights that the sharpest decline (-10.8%) occurred in trade with the Middle East and the Indian subcontinent, where volumes stalled at 1.58 million TEUs. Traffic to North America fell slightly (-1.4%) to 2.6 million TEUs, as did shipments to Latin America (-1.1%) to 957,900 TEUs. In contrast, the strongest growth was recorded in trade with sub-Saharan Africa, with volumes reaching 1.122 million TEUs (+6.3%).
Imports from the Middle East and the Indian subcontinent have declined sharply.
The analysis reveals that imports from the Middle East and the Indian subcontinent have declined sharply (-9.7%), totalling 1.65 million TEUs. There was also a slight drop in imports from North America (-0.6%, totalling 1.436 million TEUs), whereas imports from other regions of the world showed a marked increase. Leading the way were imports from the Far East, which increased by 12.6% to reach 10.774 million TEUs.
China remained the largest exporting country on the route.
Despite a sharp contraction, China remained the largest exporting country on the route. In April, Chinese exports to the US fell by 17.5% year-on-year to 749,721 TEU, while exports from India declined by 22.9%. Taiwan also recorded a decline of 11%. By contrast, Southeast Asia continued to gain market share, with ASEAN exports rising by 6.9% to 575,782 TEU. Thailand recorded particularly strong growth of 23.3%, while exports from Cambodia surged by 48.5%.
The deceleration in transpacific cargo volumes
The deceleration in transpacific cargo volumes was evident across a number of primary commodity categories. Shipments of furniture and bedding fell by 12.7%, while cargo of machinery dropped by 10.8%. Textiles declined by 15.3%, and cargo of electrical equipment decreased by 15.4%
.The Asia–US trade route remained volatile.
Meanwhile, freight rates on the Asia–US trade route remained volatile. In April, Shanghai–Los Angeles spot rates stood at USD 2,476 per FEU, which was slightly above 2025 levels. In the interim, Shanghai–New York rates reached USD 4,002 per FEU. Even stronger pricing momentum was seen for cargo moving from Japan to the US East Coast, with rates for a 40-foot container from Yokohama to New York rising 33.5% year-on-year to USD 6,224. At the same time, trade between Asia and Europe showed better performance in terms of transporting goods. In March, container volumes from Asia to Europe increased by 1.7% year-on-year to reach 1.64 million TEU. First-quarter volumes also surged by 15% to reach 5.18 million TEU.
Asia-Europe exports continued to be dominated by China
Asia-Europe exports continued to be dominated by China, with more than 75% of total shipments on the route being accounted for by the country. Meanwhile, Southeast Asia strengthened its position, increasing cargo volumes by 7.1%. Meanwhile, Northern Europe remained the largest destination region, receiving over 60% of all Asian exports to Europe.
# CTS analysis # Europe #EU container #Middle East#India #Latin America#North America # exports #China # Asia–US trade route
You Might Also Like


Recommendation News

Marine Tech
Appointment Kentaro Oshima as President & CEO Mitsui OSK Lines MOL 20 January 2026
Yachts&Cruises
Josh Weinstein, named Chair of the Global Executive Committee of CLIA 09 January 2026
Marine Cultures
Syrian maritime literary figure, Capt. Youssef Jundi : the Sea and Pen 20 December 2025
Shipping Lines
In 2025, CMA CGM reported revenue of $54.4 billion. 08 March 2026
Incidents
Ship traffic has plummeted through Bab el-Mandeb after Houthi attacks on Saudi oil sites. 27 July 2026